China is the world’s largest emitter of carbon dioxide, releasing about 13.1 billion tonnes of fossil CO2 in 2025, roughly a third of the global total of 40.0 billion tonnes. The United States (4.7 billion tonnes) and India (3.2 billion tonnes) follow, according to the European Commission’s EDGAR database (2026 report).
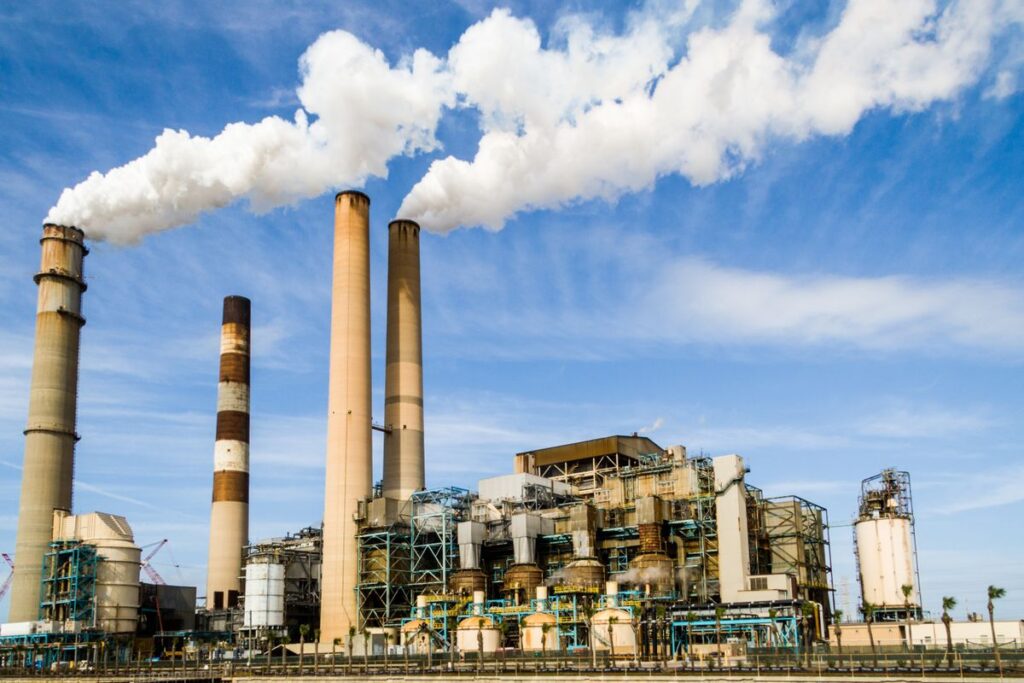
Carbon dioxide (CO2) is the main greenhouse gas produced by human activity. Most of it comes from burning coal, oil and natural gas to generate electricity, move goods and people, heat buildings and run factories. Because energy use rises and falls with production, a country’s CO2 emissions are closely tied to the size and structure of its economy. This page ranks the world’s largest emitters using the latest country data and explains what drives the differences between them.
The 20 largest CO2 emitters in the world (2025)
The table ranks countries by fossil CO2 emissions in 2025: emissions from fossil fuels and industrial processes such as cement production. Twenty countries account for 79% of the world total.
| Rank | Country | Fossil CO2, 2025 (million tonnes) | Share of world | Change vs 2024 | Tonnes per person |
|---|---|---|---|---|---|
| 1 | China | 13,057 | 32.7% | -0.5% | 9.1 |
| 2 | United States | 4,739 | 11.9% | +2.3% | 13.8 |
| 3 | India | 3,210 | 8.0% | -1.3% | 2.2 |
| 4 | Russia | 2,010 | 5.0% | -0.3% | 14.1 |
| 5 | Japan | 977 | 2.4% | -1.5% | 7.9 |
| 6 | Iran | 903 | 2.3% | +1.5% | 10.4 |
| 7 | Indonesia | 840 | 2.1% | +3.4% | 3.0 |
| 8 | Saudi Arabia | 647 | 1.6% | +0.0% | 17.4 |
| 9 | South Korea | 609 | 1.5% | +0.3% | 11.7 |
| 10 | Canada | 578 | 1.4% | +1.7% | 14.8 |
| 11 | Germany | 568 | 1.4% | -0.2% | 6.9 |
| 12 | Mexico | 524 | 1.3% | -0.2% | 3.7 |
| 13 | Brazil | 504 | 1.3% | +2.7% | 2.3 |
| 14 | Türkiye | 488 | 1.2% | +4.9% | 5.7 |
| 15 | South Africa | 392 | 1.0% | -2.8% | 6.4 |
| 16 | Vietnam | 387 | 1.0% | +3.5% | 3.8 |
| 17 | Australia | 371 | 0.9% | -2.1% | 13.8 |
| 18 | Malaysia | 302 | 0.8% | +2.3% | 8.6 |
| 19 | Egypt | 296 | 0.7% | +2.6% | 2.7 |
| 20 | United Kingdom | 292 | 0.7% | -0.9% | 4.2 |
Three points stand out. First, emissions are highly concentrated: China alone emits more than the next four countries combined. Second, the largest emitters are moving in different directions: China’s emissions fell slightly in 2025 (-0.5%) and India’s fell (-1.3%), while those of the United States (+2.3%), Indonesia (+3.4%) and Türkiye (+4.9%) grew. Third, global emissions are still rising, but only just: the world total increased by 0.5% in 2025.
The European Union as a bloc
If the 27 member states of the European Union were counted together, the EU would rank fourth, between India and Russia, with 2,445 million tonnes of fossil CO2 in 2025 (6.1% of the world total, -0.1% on 2024). Its emissions per person, 5.5 tonnes, are close to the world average of 4.9 tonnes and less than half the US level.
Total emissions versus emissions per person
Ranking by total emissions favours large countries. Ranking by emissions per person tells a different story. The average American emitted 13.8 tonnes of CO2 in 2025, about one and a half times the average Chinese resident (9.1 tonnes) and more than six times the average Indian (2.2 tonnes). Among the 20 largest emitters, the highest per-person figures belong to oil and gas producers and cold, energy-intensive economies: Saudi Arabia (17.4 tonnes), Canada (14.8), Russia (14.1), Australia (13.8) and the United States. Large emerging economies such as India, Brazil (2.3) and Indonesia (3.0) remain well below the world average of 4.9 tonnes per person, even though their totals are large.
Which economic activities produce CO2?
EDGAR also breaks global emissions down by the activity that produces them. In 2025 the split of the world’s 40.0 billion tonnes was:
- Electricity and heat generation: 15.7 billion tonnes (39%)
- Transport (road, rail, domestic and international aviation and shipping): 8.6 billion tonnes (22%)
- Fuel burned in industry (manufacturing, construction): 6.2 billion tonnes (16%)
- Buildings (heating and cooking in homes and offices): 3.3 billion tonnes (8%)
- Industrial processes (mainly cement, steel and chemicals): 3.2 billion tonnes (8%)
- Fuel production (oil and gas extraction, refining, coal mining): 2.8 billion tonnes (7%)
- Agriculture and waste: 0.2 billion tonnes (under 1%)
Seen through the lens of the sectors of the economy, most CO2 comes from the secondary sector (power generation, manufacturing, construction and industrial processes) and from transport, which serves every sector. Fuel extraction belongs to the primary sector. The tertiary sector generates few emissions directly but drives a large share of electricity, transport and building demand. This is why economies that shift from heavy industry towards services, and from coal towards cleaner electricity, tend to emit less per unit of output.
Why emissions follow economic activity
Economists often break emissions into four factors, known as the Kaya identity: emissions equal population, multiplied by output per person (GDP per capita), multiplied by the energy used per unit of output (energy intensity), multiplied by the CO2 released per unit of energy (carbon intensity). The identity explains the patterns in the table. India’s total is large because its population is large, but its emissions per person are low because output per person is still modest. Saudi Arabia and Canada combine high incomes with energy-intensive industries and climates. Countries can cut emissions while their economies grow only by lowering the last two factors: using energy more efficiently and switching to low-carbon sources such as renewables, hydro and nuclear power. When emissions fall while GDP rises, economists call it decoupling.
Economists often discuss the link between income and emissions with the environmental Kuznets curve.
CO2 versus all greenhouse gases
CO2 is not the only greenhouse gas. Methane and nitrous oxide, which come largely from farming, landfills and fossil-fuel production, add to warming as well. Measured in CO2-equivalent terms, total global greenhouse-gas emissions were about 54.1 billion tonnes in 2025, excluding land use and forestry, of which fossil CO2 made up roughly three-quarters. The difference matters for agricultural economies. Brazil emitted 504 million tonnes of fossil CO2 in 2025 but about 1,307 million tonnes of greenhouse gases in total, because of methane and nitrous oxide from cattle and crops. Indonesia’s total greenhouse-gas emissions (about 1,359 million tonnes) are likewise much higher than its fossil CO2 alone.
Why different sources give different totals
Several research groups estimate national emissions, and their totals differ because they use different methods and boundaries. EDGAR puts global fossil CO2 at about 40.0 billion tonnes for 2025, including international shipping (712 million tonnes) and aviation (625 million tonnes), which are not assigned to any country. The Global Carbon Project, another widely cited source, estimates about 38.1 billion tonnes for 2025, partly because it subtracts the CO2 that cement absorbs as it ages. Figures from different datasets should therefore not be mixed in the same comparison. All figures on this page come from EDGAR.
Sources
- EDGAR — GHG emissions of all world countries, 2026 report (Crippa, M. et al., Publications Office of the European Union, Luxembourg, 2026, JRC147815)
- EDGAR 2026 fossil CO2 country data (xlsx)
- Friedlingstein et al., Global Carbon Budget 2025, Earth System Science Data (2026)
Last updated: October 2026