
Primary economic activities are based on extracting or harvesting goods from the natural environment, supplying essential materials for human life and other industries. What are primary economic activities? They include agriculture, forestry, fishing, hunting, and mining, and are common in developing and rural areas. They use more land than any other sector while producing the lowest wealth.
In economics, human activities are categorized into four sectors or types of economic activities: the primary sector, secondary sector, tertiary sector, and quaternary sector.
Primary economic activity in brief
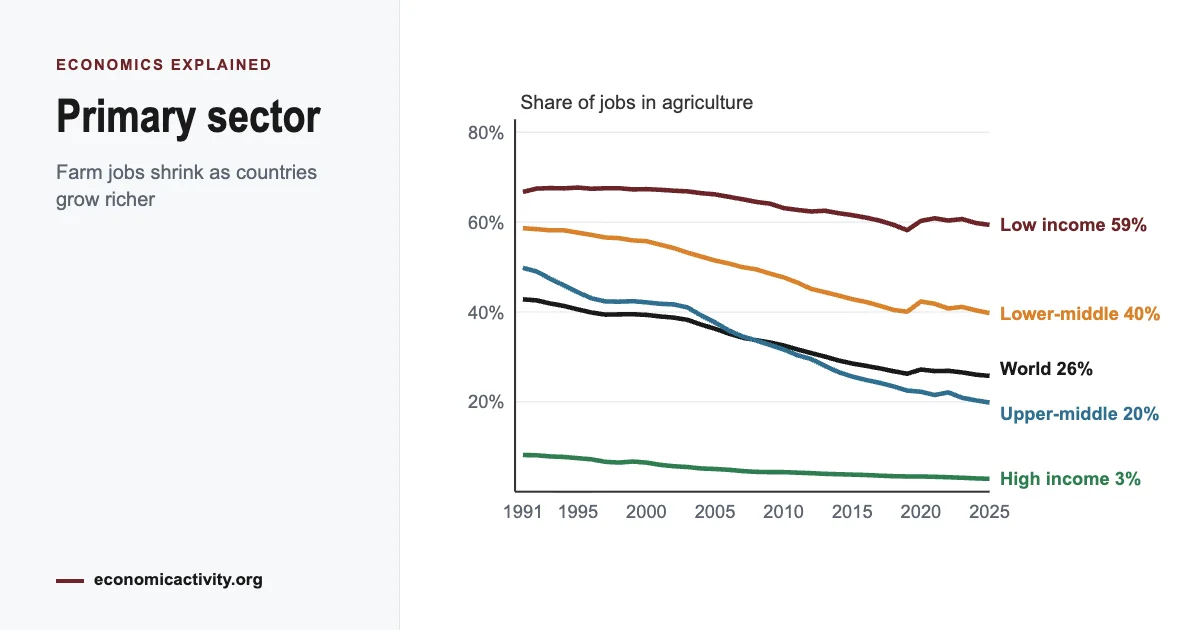
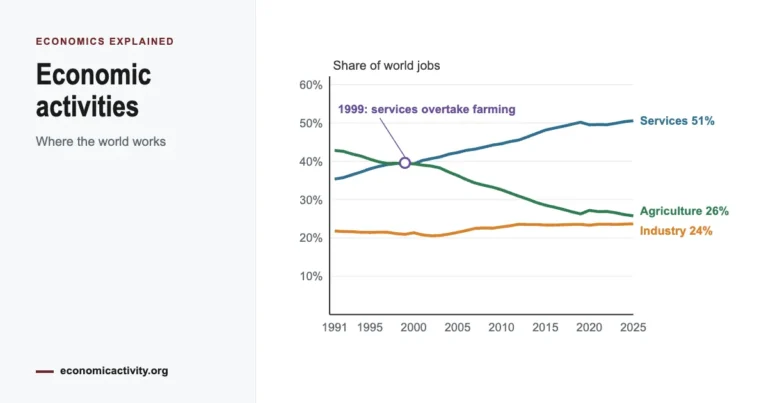
Primary economic activities are the jobs that take resources straight from nature: farming, raising livestock, forestry, fishing, hunting, mining and drilling for oil and gas. They sit at the start of every supply chain, because nearly every manufactured product, and many services, begins with a raw material that someone grew or extracted. The weight of this sector changes as countries grow richer. In poor economies most people still work on farms, often with simple tools, so each worker produces little. As farming becomes more productive, fewer farmers can feed everyone, and workers move into factories and offices. That is why about 26% of the world’s workers are still in agriculture, while the sector produces only around 4% of world output. Economists explain this pattern with diminishing returns, Engel’s law and the dual-sector model of development, all covered below. Primary goods also see sharper price swings than most products, because supply depends on weather and geology.
How the four sectors compare
The primary sector is the first link in a chain. Its raw materials feed the factories of the secondary sector, those goods are sold and delivered by the tertiary sector, and the knowledge that makes all of them more productive comes from the quaternary sector. The table puts the four side by side.
| Sector | What it does | Typical outputs | Example jobs | Share of world jobs | Share of world output |
|---|---|---|---|---|---|
| Primary | Takes resources directly from nature | Crops, livestock, timber, fish, ores, crude oil | Farmer, fisher, forester, miner | About 26% (2025) | About 4% (2025) |
| Secondary | Turns raw materials into finished goods and buildings | Food products, clothing, steel, cars, chemicals, houses | Factory worker, welder, builder, machine operator | About 24% (2025) | About 25% (2025) |
| Tertiary | Provides services to people and businesses | Retail, transport, health care, banking, tourism | Shop assistant, nurse, driver, bank clerk | About 51% (2025) | About 63% (2024) |
| Quaternary | Creates, processes and shares knowledge | Research results, software, data, patents, expert advice | Scientist, software engineer, analyst, consultant | Counted inside services | Counted inside services; R&D spending is about 2.6% of world GDP (2023) |
What are the primary economic activities?
Primary activities or primary industries comprise all economic activities based on the extraction or harvest of goods from the natural environment.
These activities contrast with the secondary activities that produce consumer goods and the tertiary sector that offers services.
Also, according to this definition, the primary economic activities are essential both to the economy and to the survival of humanity because they produce essential goods for human life.
Most of the products extracted from the primary economic activities are used in other industries where they become factors of production. For example cotton in the maquila of clothing, oilseeds in the manufacture of paints, wood in the manufacture of furniture, among others.
While other goods from this economic sector do not need any transformation or very little before their final consumption. For example fruits, vegetables, and meats.
Characteristics of primary economic activities
- Prevalent in developing countries
- Activities located mostly in rural areas
- Large share of jobs in low-income countries, small share in high-income ones
- The global market for primary activities goods. Commodity market
- Uses more land than any other sector, but produces the lowest wealth
Examples of primary economic activities
Agriculture, Forestry, Fishing, and Hunting
- Crop Production such as oilseed, grain, fruit, vegetable, melon, and tree nut farming and greenhouse, nursery, and floriculture production.
- Animal products such as cattle ranching; hog, sheep, goat, and pig farming; poultry and egg production; and animal aquaculture.
- Forestry and logging such as timber tract operations, forest nurseries, gathering of forest products and logging.
- Fishing, hunting, and trapping.
- Support activities for agriculture and forestry
Mining, Quarrying, and Oil and Gas Extraction
- Crude Petroleum and Natural Gas Extraction
- Metal ore mining such as gold, iron, silver, copper, lead, and uranium.
- Nonmetallic Mineral Mining and Quarrying such as stone, crushed and broken Limestone and granite, construction sand and gravel, kaolin and ball clay, clay and ceramic.
- Coal Mining.

History of primary economic activities
Centuries ago, primary activities were the main economic activity. For example, in the United States of every twenty workers, nineteen worked in agriculture, fishing, forestry, and mining. While today it takes less than one in twenty workers to feed more than 300 million Americans and get a surplus to export.
Thanks to increments in agriculture productivity, we are now able to produce more food with fewer resources. Food is better and cheaper than 100 years ago, now we spend most of our income on goods and services like cars, smartphones, college, entertainment, etc.
Primary economic activities in the world economy
Today agriculture, forestry and fishing employ about 26% of the world’s working population (2025). This share is falling and varies widely by region: about 49% in Sub-Saharan Africa and 42% in South Asia, compared with about 7% in Europe and Central Asia and about 1.5% in North America.
In many countries, a high percentage of the workforce works in this sector because of low agricultural productivity. That is why primary economic activities are the most important sector in many developing countries, but not in developed countries. Even when most of the world’s primary production comes from the latter.
The economic logic of the primary sector
Why does a sector that feeds the whole world produce such a small share of its income? Economists answer with a handful of simple models that appear in almost every introductory textbook.
Diminishing returns on land
The English economist David Ricardo noticed two centuries ago that land is fixed while labor is not. If more and more workers farm the same field, each extra worker adds less to the harvest than the one before, because they share the same soil, water and sunlight. This is the law of diminishing returns.
Example: A family farm produces 1,000 kg of maize with one worker. A second worker raises the harvest to 1,800 kg (+800 kg), a third to 2,300 kg (+500 kg) and a fourth to 2,500 kg (+200 kg). The land has not changed, so each extra pair of hands matters less. The only way to escape the trap is better technology: improved seeds, fertilizer, irrigation or machinery.
Engel’s law: why food takes a smaller share of income
In the 1850s the German statistician Ernst Engel found that as families get richer, they spend more on food in total but a smaller share of their income on it. People can only eat so much, so extra income goes to housing, transport, education, health and entertainment instead.
Example: A household earning $1,000 a month spends $500 on food, or 50% of its income. When its income doubles to $2,000, food spending rises to $700, but that is now only 35% of income. Repeat this across a whole country and the farm sector’s share of GDP falls even while farmers produce more than ever.
The dual-sector model: moving workers off the farm
The economist Arthur Lewis described poor economies as having two parts: a traditional farm sector with more workers than it really needs, and a modern sector of factories and offices that pays higher wages. Because extra farm workers add very little to output, moving them into the modern sector raises total production without reducing the harvest much. As this continues, the pool of spare farm labor dries up and wages start to rise, a point economists call the Lewis turning point.
Why primary prices are so unstable
Demand for basic foods and fuels changes little when prices change, because people need them anyway. Supply, on the other hand, depends on rainfall, pests and the discovery of new mines. When supply jumps and demand stays put, prices must fall a long way to clear the market.
Example: A good year raises a country’s coffee harvest by 10%. Buyers do not want much more coffee, so the price drops by 20%. Farmers now sell 10% more beans at 20% less each, and their total income falls. This is the farm-income paradox: a bumper crop can leave farmers poorer.
Over the long run, some economists (the Prebisch-Singer hypothesis) argue that prices of raw materials tend to fall compared with the prices of manufactured goods, so countries that export mainly commodities must sell ever more of them to buy the same imports.
The resource curse and Dutch disease
Finding oil or minerals sounds like pure luck, yet many resource-rich countries grow slowly. When the Netherlands began exporting large amounts of natural gas in the 1960s, the inflow of foreign money pushed up the value of its currency, which made its factories’ exports more expensive abroad. Economists named this effect Dutch disease. Resource wealth can also invite corruption and leave a country dependent on a single product whose price it cannot control.
Primary sector examples by country
The same models play out very differently across the world. These country pages show how the primary sector fits into each economy.
India: agriculture employs about 42% of workers but produces only about 16% of GDP (2025). Output per farm worker is therefore far below the national average, a textbook picture of the dual-sector model at work.
Senegal: about 30% of workers are in agriculture, which produces about 17% of GDP (2025). Food products, largely fish and groundnut products, make up about 22% of merchandise exports (2024).
Australia: ores and metals make up about 35% and fuels about 27% of merchandise exports (2025), yet farming, forestry and fishing employ only about 2% of workers. Modern mining uses huge machines and few people, so a large primary sector can sit inside a service-based economy.
Canada: fuels account for about 27% of merchandise exports (2025), while agriculture employs about 1.1% of workers. Like Australia, Canada is a rich economy whose exports still lean heavily on natural resources.
Nauru: this small Pacific island depended for decades on phosphate mining. Once the richest deposits ran out, the country had to search for new sources of income, a clear case of the risks of relying on a single non-renewable resource.
United Kingdom: agriculture employs about 0.9% of workers and produces about 0.6% of GDP (2025). The country where the Industrial Revolution began now shows the end point of the long shift out of primary work.
More:
World Bank
NAICS
Last updated: October 2026

Leave a Reply