
Key Economic Insights: The economy of Kiribati generates an estimated GDP of $307.9 million ($2,289 per capita) supporting a population of 133,000. Productive output is anchored by 70% services, 7% industry and manufacturing, and 23% agriculture and natural resource extraction. Key merchandise exports include fish, ships, coconut oil, copra, and raw sugar, directed primarily toward China, Fiji, Australia, Taiwan, and South Korea.
Kiribati, with a population of about 134,518 (As of 2024), is ranked among the world’s smaller nations by population. Located in the Pacific Ocean, it covers 810 square kilometers, ranking 167 in surface area, just below the Turks and Caicos Islands.
Kiribati had a GDP of about 307.9 million USD (As of 2024), placing it among the smallest economies in the world. In terms of GDP per capita, Kiribati recorded approximately 2,288.6 USD (As of 2024), reflecting its lower-middle-income status. Source: World Bank – Kiribati.
Despite facing economic challenges, Kiribati continues to strive for growth and development in various sectors to improve its economic position on the world stage.
Kiribati Economic Structure & Sector Analysis
| Economic Dimension | Official Indicator (2024–2026) | Authoritative Source |
|---|---|---|
| GDP & Macro Output | Nominal GDP: Official World Bank Data | Per Capita: $2,289 | World Bank WDI / IMF |
| Sector Breakdown | Services: 70% | Industry: 7% | Agriculture: 23% | World Bank National Accounts |
| Trade & Commodities | Top Exports: fish, ships, coconut oil, copra, and raw sugar (Total: Official UN Comtrade) | UN Comtrade / OEC |
| Demographics & Labor | Population: Official Census Tracked | Distributed workforce across formal & primary sectors | ILO / UN Population Division |
| Strategic Trade Corridors | Leading Trade Partners: China, Fiji, Australia, Taiwan, and South Korea | World Bank WITS / IMF DOTS |
- Primary activities: 23% of GDP.
- Secondary activities: 7% of GDP.
- Tertiary activities: 70% of GDP.
Primary Sector of Kiribati
With 41.98% of the land dedicated to agriculture, the country produces a variety of crops and animal products such as coconuts, bananas, vegetables, taro, tropical fruits, pork, chicken, nuts, eggs, and pork offal.
Despite contributing 23% to the GDP, agriculture plays a crucial role in Kiribati’s economy by providing food security and employment opportunities. The diverse range of agricultural products highlights the sector’s importance in sustaining the country’s population and supporting local livelihoods.
Kiribati’s geological diversity, with its scattered atolls and fertile soil, impacts resource availability. The primary sector relies on copra from coconuts and fish, while phosphate production ceased in 1979. These resources sustain the economy through agriculture and fishing industries.
Secondary Sector of Kiribati
In Kiribati, the main industrial products are handicrafts and construction materials. Handicrafts are traditionally made by local artisans, while construction materials support infrastructure development in the country.
In 2023, Kiribati’s manufactures exports accounted for a minimal percentage of the total exports, indicating their insignificant contribution to the country’s overall export economy.
Tertiary sector of Kiribati
The tertiary sector in Kiribati involves providing intangible services to enhance productivity and meet needs. Key activities include healthcare, education, banking, tourism, transportation, and telecommunications. These services contribute to the country’s economic development and well-being.
With an annual influx of 12,000 tourists, constituting 0.0914 of its population, the industry thrives. The pristine beaches of Tarawa Atoll and the picturesque Christmas Island are among the top destinations, attracting visitors worldwide with their natural beauty and cultural richness.
Another example of tertiary economic activity is the mobile cellular sector, which boasts around 64,000 subscriptions, facilitating communication and supporting technological growth. With 49 subscriptions per 100 inhabitants, it enhances connectivity, enabling local businesses and services to thrive, ultimately fostering innovation and economic development.
International Trade of Kiribati
Import Activities of Kiribati
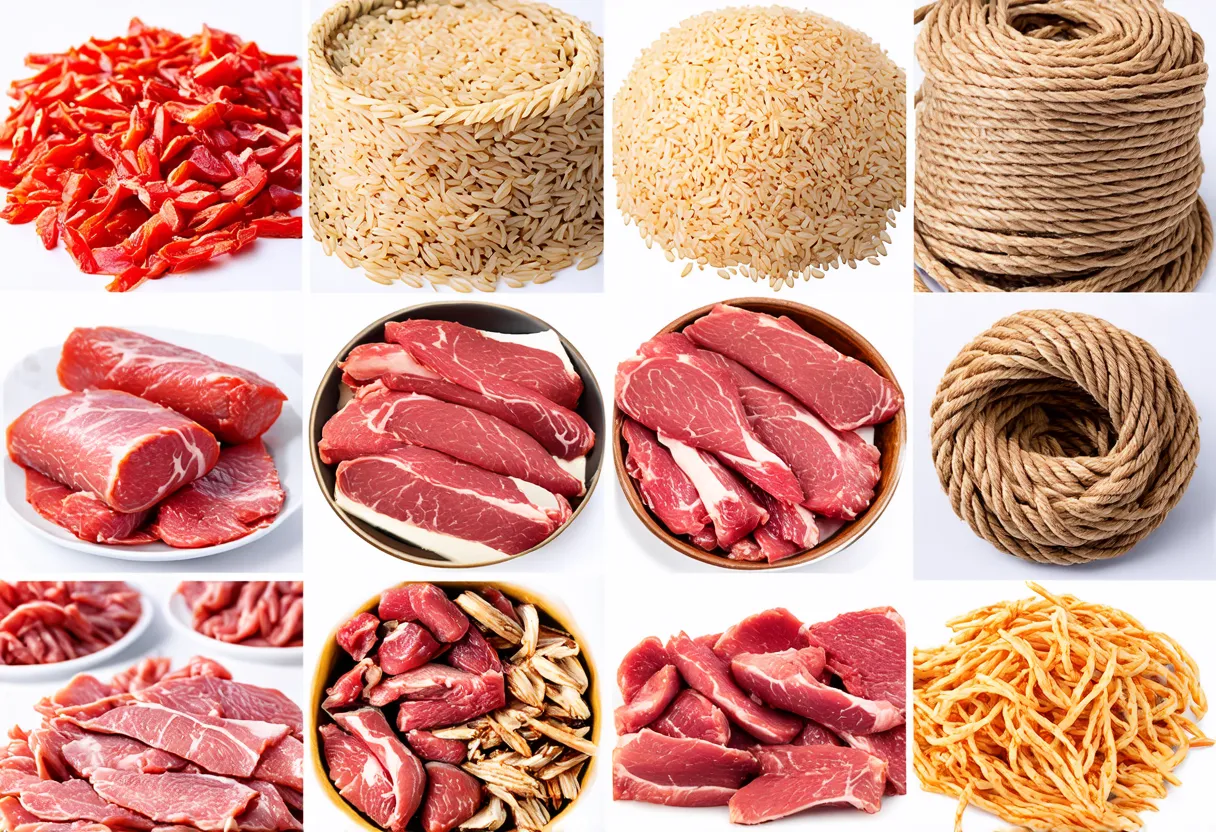
Kiribati’s import activities are of high importance to the economy. Its merchandise imports totaled approximately 173.83 million USD (As of 2021), far exceeding its exports and reflecting heavy dependence on imported goods. Source: World Bank WITS – Kiribati.
Kiribati’s major import activities include ships, refined petroleum, rice, twine and rope, and prepared meat. Its top import partners include China, Fiji, Australia, Taiwan, and South Korea. Source: CIA World Factbook – Kiribati.
Exports Activities of Kiribati

Kiribati’s merchandise exports totaled approximately 8.86 million USD (As of 2021), a small share of GDP, so export activities hold low importance relative to imports in the country’s economy. The country derives far more external income from fishing-licence fees paid by foreign fleets than from goods exports. Source: World Bank WITS – Kiribati.
Kiribati primarily exports fish, ships, coconut oil, copra, and raw sugar. Its key export partners include Thailand (55%), Philippines (15%), Japan (10%), Indonesia (8%), and South Korea (4%).
Kiribati economy challenges in 2024
Kiribati faces challenges from its fragile environment, narrow economic base, and a public sector-dominated economy (phosphate mining ceased in 1979). The country relies heavily on fishing-licence revenue, remittances, development assistance, and drawdowns from its Revenue Equalization Reserve Fund (RERF) sovereign wealth fund, which stood at roughly 330% of GDP at end-2023. Source: IMF – Kiribati.
Sources
- World Bank – Kiribati
- IMF – Kiribati
- CIA World Factbook – Kiribati
- UN Comtrade Plus: Trade Flow
- World Bank WITS – Kiribati Trade
Last updated: August 2026



Leave a Reply